Two Billion Documents a Week to Produce a List of Numbers
Table of Contents
One query. Seven days. Here’s what it cost.
Execution count           7,629
Documents examined    2,045,593,132
Keys examined         2,045,593,132
Bytes read                   139 GB
Total execution time        1.86 hr
Average per call             876 ms
Docs examined : returned       1.00
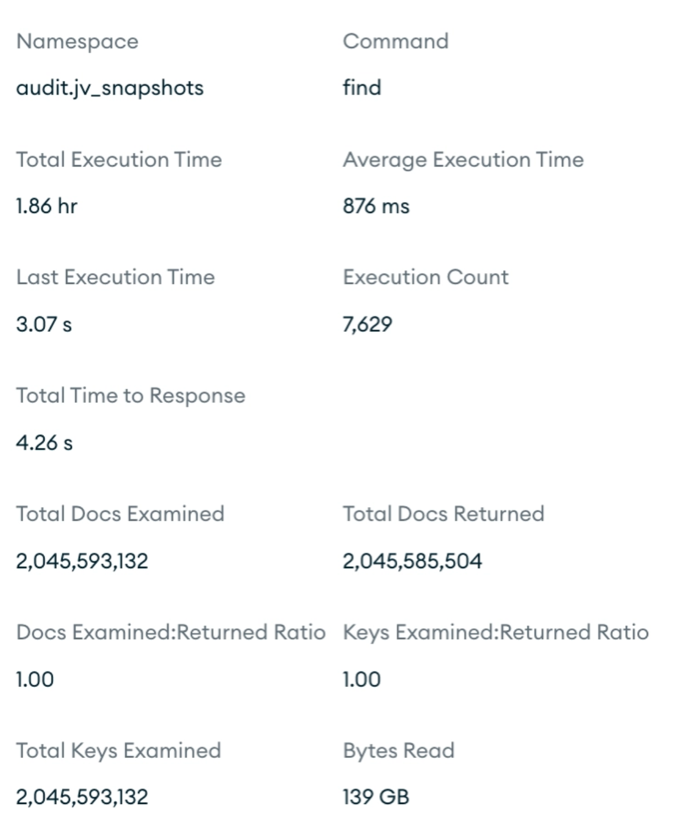
The collection holds 102 million documents. This query read all of them, twenty times over, every week.
It did that to produce a list of numbers. Around ten thousand of them per call.
And the ratio at the bottom is why nobody found it for months.
MongoDB on a production cluster, Spring Data MongoDB, JaVers 7.11.4. This is part two of a pair; part one covers how JaVers audit logging works, and you need one fact from it, which I’ll repeat below.
1. Why the ratio hid it
Every guide to MongoDB performance tells you to hunt for a bad docs examined to docs returned ratio. Read 10,000 documents, return 3, and your ratio is 3,333. That’s the shape of a missing index, and it’s what every dashboard sorts by.
This query’s ratio was 1.00. Perfect. It returned every single document it read.
That’s the trap. A ratio measures precision, not volume. It tells you whether you’re reading the right documents. It says nothing about whether you should be reading documents at all.
BAD RATIO          read 10,000  ->  return 3        obvious, everyone finds this
PERFECT RATIO      read 268,000 ->  return 268,000  invisible, and far more expensive
The second line is this query. It read 268,000 documents per call and returned every one of them, then discarded 96% of the values in application code, where no database metric can see it.
Two other things helped it hide:
- It’s an async worker. No user waits on it, so no one ever filed a ticket about a slow page.
- It’s fast enough per call. 876 ms looks unremarkable on its own. Only the weekly total is alarming, and nothing was totalling it.
It surfaces the moment you sort Query Insights by documents examined instead of by ratio. Which is not the default, and not what the guides tell you to do.
2. What the query was for
One fact from part one, and it’s the whole reason this query exists:
There is no commits collection. A commit isn’t stored as its own document anywhere. It exists only as a numeric id repeated across all the snapshots that share it, and one commit produces roughly twenty-seven snapshots.
So when a catch-up worker needs “the next 10,000 commit ids after id X”, it has nowhere to look them up. It has to walk the snapshot collection and deduplicate.
The original implementation did exactly that, and did the deduplication in Java:
query.fields().include(FIELD_COMMIT_ID);        // project just the commit id
query.addCriteria(where(FIELD_COMMIT_ID).gt(lastSeen));
query.with(Sort.by(ASC, FIELD_COMMIT_ID));

while (cursor.hasNext() && result.size() < limit) {
    BigDecimal currentId = new BigDecimal(rawId.toString());
    if (!currentId.equals(lastId)) {            // skip the repeats
        result.add(CommitId.valueOf(currentId));
        lastId = currentId;
    }
}
Read that and it looks careful. It projects a single field, it uses an indexed field, it sorts on the index, it stops at the limit. Nothing about it looks like a two-billion-document query.
The arithmetic says otherwise:
268,000 documents pulled off the cursor
 10,000 ids kept

     26 documents read for every id that survived
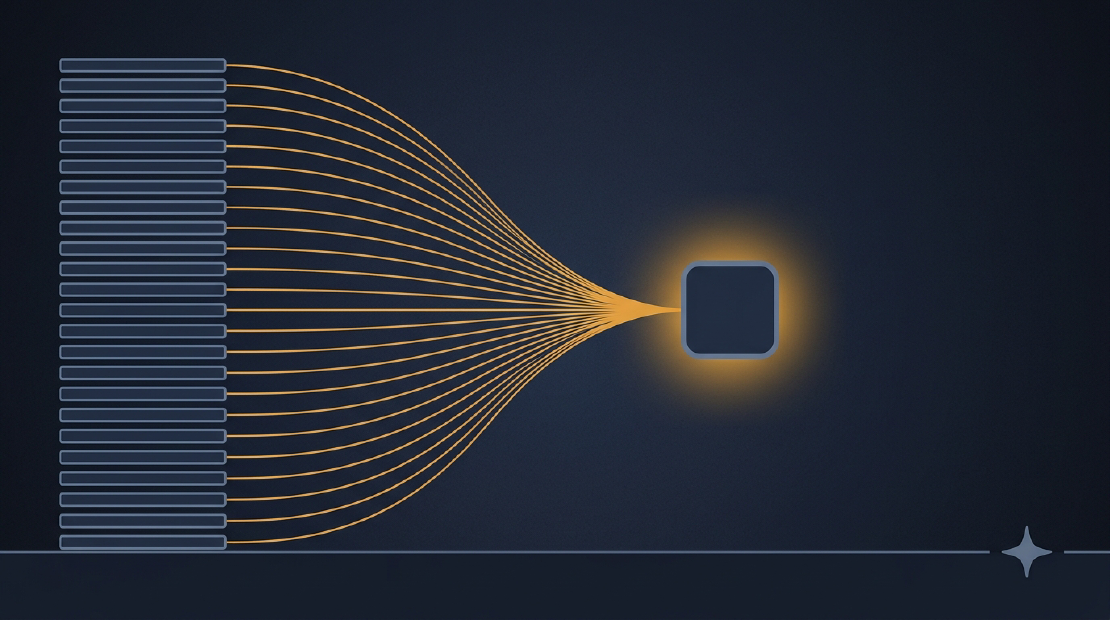
Twenty-six, because that’s the snapshot fan-out from part one. Every commit id appears roughly twenty-seven times in a row, and the loop walks all of them to keep one.
3. What a projection is, and how this one broke
The bug lives entirely in a part of the query most people never think about, so it’s worth being precise about what that part is.
This is the first of the two causes, and every query has two halves:
- The filter decides which documents come back. Here:
commitMetadata.id > lastSeen. - The projection decides which fields of those documents come back. Here: just
commitMetadata.id.
This isn’t a MongoDB idea, it’s a database idea. In SQL the projection is your SELECT list and the filter is your WHERE clause. Both are evaluated by the database, before anything crosses the network.
The filter in this query was fine. The entire bug was in the other half.
What a covered query is
A covered query is one the database answers entirely from an index, without opening a single document. It’s the fastest thing it can do, and the rule is:
Every field in the filter and in the projection must be available from the index.
The filter uses commitMetadata.id. The projection asks for commitMetadata.id. There’s an index on commitMetadata.id. So this should have been covered.
Why it wasn’t
Two facts that only cause trouble together.
MongoDB returns _id in every projection unless you explicitly exclude it. That’s a MongoDB rule, not a Spring Data one. So this:
query.fields().include(FIELD_COMMIT_ID);
means “give me commitMetadata.id, and also _id, obviously”. Nobody typed _id and nobody wanted it.
A secondary index doesn’t store _id as a readable field. This is the part I had wrong in my head for years. An index entry holds two things: the indexed value, and an internal pointer to where the document lives on disk.
index: commitMetadata.id_1

   value        pointer to the document
   1001    ->   (disk location)
   1002    ->   (disk location)
That pointer is how MongoDB finds a document. It is not the _id value, and you can’t read _id out of it. The only way to get _id is to follow the pointer and open the document.
Put those two together and you have the whole problem. Asking for _id, which you did without knowing it, forces MongoDB to open every single document, even though every field you actually wanted was already sitting in the index.
That’s what the identical numbers at the top were saying. Keys examined and documents examined were exactly equal, 2,045,593,132 of each. Every index entry triggered a document fetch. When those two match on a query that only touches indexed fields, look at the projection first.
The fix is one method call:
query.fields().include(FIELD_COMMIT_ID).exclude("_id");
What it buys: documents examined drops to zero. The document-fetch share of that 139 GB disappears.
What it does not fix: MongoDB still returns all 268,000 index entries, and Java still throws 96% of them away.
4. The other half: deduplicating in the wrong place
Look again at what the loop does. It reads a value, compares it to the previous one, and discards it if they match.
That’s a database operation being done in application code, and it costs on both sides:
- MongoDB walks every repeated index entry and sends it over the wire.
- Java allocates a
BigDecimalfor each one, 268,000 objects per call, to keep 10,000.
MongoDB can skip the repeats natively. Given a sorted index, it can seek to the next distinct value rather than reading through the duplicates one at a time. The planner calls this a DISTINCT_SCAN, and instead of walking 27 identical entries it jumps straight past them.
So the fix is to push the deduplication down to the server:
Aggregation.newAggregation(
    Aggregation.match(Criteria.where(FIELD_COMMIT_ID).gt(lastSeen)),
    Aggregation.sort(Sort.Direction.ASC, FIELD_COMMIT_ID),
    Aggregation.group(FIELD_COMMIT_ID),
    Aggregation.limit(limit));
Four stages. The planner recognises the shape, picks a DISTINCT_SCAN, serves everything from the index and stops at the limit.
What it buys: the repeats stop crossing the wire. On a benchmark at limit = 100, the pipeline reads 224 index entries and opens zero documents. Scaled to the production limit of 10,000 ids, that’s roughly 22,000 entries rather than 268,000 documents.
5. What $group actually does to your documents
The aggregation is four stages, and it’s worth walking a tiny example through them, because $group changes the shape of your data in a way that isn’t obvious and that decides whether the query stays covered.
Say we ask for the next 2 commit ids after 1000. The raw data holds seven documents across four commits:
_id   commitMetadata.id   globalId               state
A1          1000          Invoice/x              {...}
A2          1000          BillLine/y             {...}
A3          1000          BillLine/z             {...}
B1          1001          Vendor/v               {...}
B2          1001          VendorBankAccount/w    {...}
C1          1002          Invoice/q              {...}
D1          1003          PurchaseOrder/p        {...}
$match { commitMetadata.id > 1000 } keeps B1, B2, C1, D1.
$sort { commitMetadata.id: 1 } moves nothing, and that is exactly the point. The index is already in this order, so the sort is free. Its job is to let the planner choose a DISTINCT_SCAN, which is why it has to sit here and not later.
$group { _id: "$commitMetadata.id" } is where the shape changes:
IN
{_id: B1, commitMetadata: {id: 1001}, globalId: {entity: "Vendor"},            state: {...}, version: 3}
{_id: B2, commitMetadata: {id: 1001}, globalId: {entity: "VendorBankAccount"}, state: {...}, version: 1}

OUT
{_id: 1001}
Two things happened at once, and people usually only notice the first:
- Duplicates merged. B1 and B2 share commit 1001, so one row survives. That’s the deduplication, done server-side.
- Every other field was dropped.
globalId,state,version, all gone. Not aggregated, not summarised, not kept. Simply never asked for.
Also note what _id means now: it’s the grouping key, not the source document’s _id. Same name, completely different thing. That’s the one detail that makes the resulting Java look wrong until you know it.
Why keeping one extra field would undo everything
Suppose you wanted the entity name alongside each commit id. You’d add an accumulator:
{ $group: { _id: "$commitMetadata.id",
            nbSnapshots: { $sum: 1 },
            firstEntity: { $first: "$globalId.entity" } } }
Perfectly reasonable, and it destroys the optimisation. globalId.entity is not in the commitMetadata.id index, so MongoDB has to open documents to read it. One extra line and the covered query is gone, right back to fetching from disk.
If you come from SQL, the contrast is worth knowing. Postgres would reject SELECT commit_id, state ... GROUP BY commit_id outright, because state is neither grouped nor aggregated. MongoDB doesn’t reject it. It drops the field silently. Convenient here, and a good way to lose data you assumed was still there.
$limit 2 gives {_id: 1001}, {_id: 1002}, and Java maps them.
What the database actually touched
Here’s the index, sorted, and what the scan does to it:
value    pointer
1000  ->  A1
1000  ->  A2
1000  ->  A3
1001  ->  B1     <- positions here: first value greater than 1000
1001  ->  B2     <- SKIPPED, same value
1002  ->  C1     <- SEEKs straight to the next distinct value
1003  ->  D1        limit reached, stop
Two index entries read. Zero documents opened.
The old version fetched B1, B2 and C1 off disk to extract two numbers, then discarded B2 in the Java loop. Scale that up to a real call and it’s 268,000 documents opened, against a few thousand index entries and nothing opened at all.
6. The stage order is the whole thing
This is the part worth the article, and it’s the part I’d have got wrong by guessing.
Those same four stages, in a different order, are a catastrophe. Both measured on the same production data, same starting point, asking for 100 ids (a small limit keeps the comparison readable; the effect gets worse with bigger ones):
| Pipeline | Keys examined | Time |
|---|---|---|
$match → $group → $sort → $limit | 5,661,412 | 25,471 ms |
$match → $sort → $group → $limit | 224 | 4 ms |
Same stages. Same result. Twenty-five thousand times more index reads, and six thousand times slower.
Why: MongoDB can only push a $limit down into the index scan if nothing in between forces it to see all the rows first.
- With
$sortbefore$group, the sort is satisfied by the index order, so the pipeline stays a streaming scan.$limitpushes right down to the scan, which stops after 224 entries. - With
$sortafter$group, the sort has nothing to lean on. It becomes a blocking stage: it must have every group before it can order any of them. So$groupwalks all 5.6 million distinct commit ids, the sort buffers them, and only then does$limitcut it to 100.
The first version is slower than doing nothing at all. Rewriting a query “to use the database properly” and making it thousands of times worse is an entirely normal outcome if you don’t check the plan.
So: always run explain("executionStats") on an aggregation before shipping it. Not to admire it, to check three fields:
"stage"             DISTINCT_SCAN, or a plain IXSCAN walking every entry
"totalDocsExamined" 0 if the query is genuinely covered, anything else if it isn't
"totalKeysExamined" whether your $limit reached the scan, or the pipeline
                    walked everything and trimmed at the end
totalDocsExamined is the one to check first. It’s a single number that tells you whether the projection is doing what you think, and it’s the number that went from two billion to zero here.
7. What it added up to
The headline is exact, and it’s the one that matters:
                       per call            per week (7,629 calls)

documents examined     268,000  ->  0      2,045,593,132  ->  0
Zero. A covered DISTINCT_SCAN opens no documents at all, so the entire disk-fetch side of this query disappears rather than shrinking.
Index reads drop too, though less dramatically:
index keys read 268,000 -> ~22,000 2,045,593,132 -> ~170 M
That one is an estimate, so treat it as such: the benchmark above read 224 entries to return 100 ids, and the production call asks for 10,000. Scaling that ratio gives roughly 22,000. I didn’t re-measure at the production limit, and I’d rather label the number than quietly imply 224 covers both.
Read as a progression, since each fix does a different job:
BEFORE   read 268,000 keys  ->  fetch 268,000 docs  ->  dedup in Java  ->  10,000 ids   876 ms

FIX 1    read 268,000 keys  ->  ..................  ->  dedup in Java  ->  10,000 ids

FIX 2    read ~22,000 keys  ->  ..................  ->  ............   ->  10,000 ids
Fix one stopped it touching disk. Fix two stopped it reading the repeats. Neither alone gets you there: excluding _id still ships a quarter of a million entries over the wire, and the aggregation without a covered index still fetches documents.
One gotcha for anyone reading the resulting code. After $group, the output document is {_id: <the commit id>}. The field you grouped by is gone, replaced by _id. So the mapping code reads _id, which looks wrong until you remember what $group does to the shape.
8. What generalises
Three things, none of them about MongoDB specifically.
A perfect ratio is not a clean bill of health. Efficiency metrics measure whether you read the right rows. They don’t measure whether the question was worth asking. Sort your slow-query dashboard by total volume at least once, and see what’s been hiding behind a 1.00.
Deduplicating, filtering or counting in application code means the database sent you everything first. Every distinct() in a stream over a database result is a query you could have pushed down. Most of the time it doesn’t matter. When the fan-out is twenty-seven to one, it’s the whole cost.
Defaults you didn’t type are still in your query. Nobody wrote _id in that projection. It was there anyway, and it turned an index-only query into 139 GB of disk reads. The same shape shows up in JPA fetch types, where the annotation nobody wrote decides how much your export costs, and in a feature flag bill, where a cache key nobody chose decides the invoice.
And the one that took the longest to accept: the async worker nobody watches is exactly where this lives. No user waits on it, no alert fires, no ticket gets raised. It just quietly reads a hundred million documents twenty times a week until somebody sorts the table by a different column.
If the fan-out that made this expensive doesn’t make sense yet, part one explains where twenty-seven snapshots per commit comes from: JaVers from first principles.